Find where your software lacks SEO & AEO coverage. Book a Strategy Call


Your SEO report lands on the first Monday of the month. Organic traffic is up. Rankings are up. Then your CEO asks, “How many of this month’s demos came from SEO?” and nobody answers quickly.
That pause is the whole problem. Most SEO reports measure the website. A B2B SaaS company needs to measure the pipeline.
The B2B SaaS SEO KPIs that matter are seven numbers in three layers. Visibility: are buyers finding the right pages? Conversion: do they ask for a demo, and are those requests real? Revenue: what pipeline and payback does it add up to? If you can only show leadership three, show demo requests from non-branded search, pipeline sourced from organic, and organic CAC payback. The other four explain why those three move.
This guide is for seed to Series B teams that sell through demos or trials and have a small marketing team. It skips enterprise reporting stacks. We’re an SEO and AEO agency, so we have a stake in this. Every outside figure links to its source, and we dated the ones that change.
TL;DR
- Track seven KPIs: three for visibility, two for conversion, two for revenue.
- Show leadership three: non-branded demo requests, organic-sourced pipeline and organic CAC payback.
- Stop leading with six: total sessions, average position, domain rating, bounce rate, raw impressions and ranking-keyword counts.
- Published “good” conversion rates run from 0.5% to 12%, so set targets against your own 90-day baseline, by page type.
What B2B SaaS SEO KPIs are
A B2B SaaS SEO KPI is a number that shows whether search is producing pipeline you can trace to revenue, and that you’d change your plan over. Search here means Google and AI assistants together. A metric is anything you can count. A KPI is a metric with a target and an owner. If a number moved 30% and you wouldn’t do anything differently, it’s a metric.
Write targets so they can fail. “Grow organic traffic” can’t. “Raise demo requests from comparison and alternatives pages from 14 to 20 a month by the end of Q1” can (an example, not a benchmark).
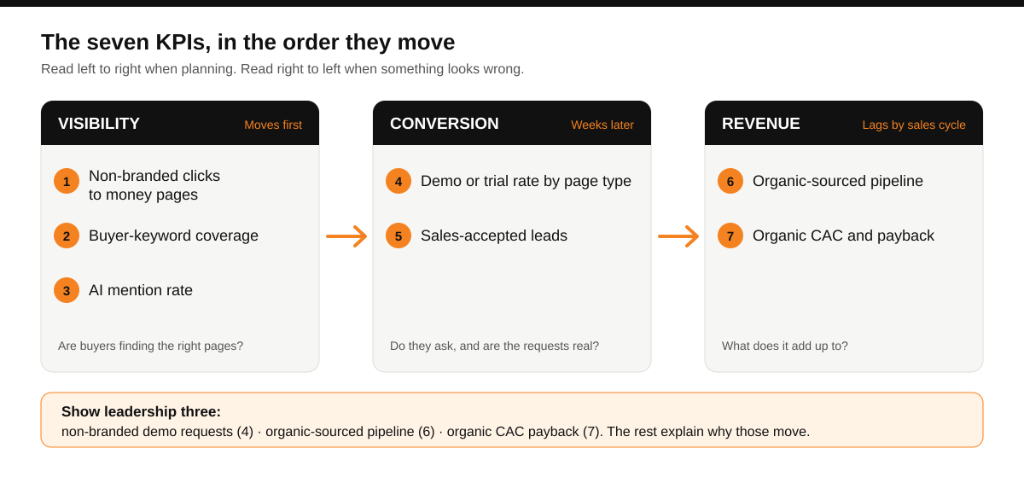
The seven KPIs at a glance
| # | Layer | KPI | Where to read it | If it moves, do this |
|---|---|---|---|---|
| 1 | Visibility | Non-branded clicks to money pages | Search Console, brand queries excluded | Falling: check if a money page lost its ranking or got an AI Overview above it. |
| 2 | Visibility | Buyer-keyword coverage | Rank tracker, 20 to 50 keywords from sales calls | Stuck on page 2: add links to that page. No ranking page: build it. |
| 3 | Visibility | AI mention rate | A fixed set of 20 to 30 buyer prompts, run repeatedly | Low on one platform: see which sources it cites and get onto them. Wrong facts: fix the page behind them. |
| 4 | Conversion | Demo or trial rate by page type | GA4 plus your demo form | Traffic up, rate down: fix the page’s promise, CTA or pricing clarity. |
| 5 | Conversion | Sales-accepted leads from organic | CRM | Low accepted share: you rank for people who won’t buy. Cut or retarget those pages. |
| 6 | Revenue | Organic-sourced pipeline ($) | CRM, with the buyer’s own answer beside it | Flat while demos rise: ask sales about lead quality before touching SEO. |
| 7 | Revenue | Organic CAC and payback | Finance plus CRM | Slower than paid: find the content costing most per deal and stop making more of it. |
When something looks wrong, read the table from the bottom up. Start at revenue, then walk left until you find the layer that changed.
KPI by KPI: how to read each one
1. Non-branded clicks to money pages
Money pages are the ones a buyer visits while choosing: comparison pages, competitor alternative pages, use-case, integration and pricing pages. Count clicks to those pages from queries that don’t include your brand name. Total traffic mixes buyers with students and job seekers. This number doesn’t.
In Search Console, filter the Pages report to those URLs and exclude brand terms. Search Console also has a branded queries filter.
Read clicks and impressions separately. In Seer Interactive’s data, click-through rate on queries where a brand was cited in an AI Overview halved in October 2025, from 2.52% to 1.21%. Clicks held flat at about 400,000 because impressions had more than doubled (Seer, April 2026). A falling CTR is not automatically bad news.
The same study found AI Overviews on 36% of informational queries, but only 8% of commercial and 5% of transactional ones. Your blog traffic is far more exposed than your money pages.
2. Buyer-keyword coverage
Pick 20 to 50 keywords a buyer types when choosing software like yours (commercial investigation queries). Take them from sales calls, demo-form answers and competitor pages. Then track how many have one of your pages in the top 3 and the top 10 using a dedicated B2B SEO rank tracker.
Average position across every keyword you rank for hides the thing you care about: five money keywords on page 3, buried under thousands of long-tail terms on page 1. A rule of thumb: a page stuck on page 2 usually needs links and internal links, and a keyword with no ranking page usually needs the page. Freeze the list for a quarter, or the trend means nothing.
3. AI mention rate
AI mention rate is the share of answers that name you, across a fixed set of 20 to 30 buyer prompts that don’t include your brand name. Nobody can promise you a mention. You can measure whether the signals are improving.
Run every prompt many times. SparkToro’s study had 600 volunteers run 12 prompts through ChatGPT, Claude and Google’s AI, 2,961 runs in total. Two runs returned the same brand list less than once in 100 times, and the same list in the same order less than once in 1,000 (SparkToro, January 2026). So ignore position. Track the percentage across many runs, which SparkToro’s Rand Fishkin concluded is a reasonable metric across dozens to hundreds of prompts.
Keep your own brand name out of the prompts. Discovered Labs, which sells AI visibility work, audited five client prompt sets and found inflation in all five. In the worst case the reported mention rate was 10.8%, against 1.9% on unbranded prompts (Discovered Labs, May 2026). Our guide to tracking brand mentions in AI search has the full setup.
4. Demo or trial rate by page type
Divide demo or trial requests by sessions, separately for comparison, alternatives, integration, pricing, feature and blog pages. One blended rate hides the point.
Say a comparison page gets 400 visits a month at a 5% rate, and a blog post gets 4,000 visits at 0.3%. That’s 20 demo requests against 12, from a tenth of the traffic. A page with traffic and a weak rate has a page problem: an unclear CTA, no pricing, the wrong promise. A page with a good rate and little traffic has a ranking problem. The fixes differ.
5. Sales-accepted leads from organic
Count the leads your sales team accepts, not the ones marketing qualifies. An MQL means someone filled in a form. Sales-accepted means a rep agreed it’s a real buying conversation. Divide accepted leads by organic demo requests for reliable closed-loop attribution.
A low share means you’re ranking for students, job seekers and competitors. Fix it by cutting or retargeting those pages, not by rewriting the form. You need one written definition of “accepted” that sales agrees to.
6. Organic-sourced pipeline
This is the dollar value of opportunities whose original source in your CRM is organic search. Report sourced and influenced pipeline separately. “Influenced” means organic touched the deal at some point, and those deals overlap with every other channel, so never add the two.
Sourced credit undercounts, which is why the measurement section below matters. Put the buyer’s own answer from the demo form next to it.
7. Organic CAC and payback
Organic CAC (Customer Acquisition Cost) is total SEO cost (agency, writers, tools, internal time) divided by new customers from organic in the same period. Payback in months is CAC divided by monthly revenue per customer times gross margin. Compare it with paid payback over the same period.
SEO compounds, so one quarter looks worse than a trailing 12 months. And with two closed deals, a third one cuts CAC by a third. Until you have more deals, lead with KPI 6 instead.
A worked example: from spend to payback
These numbers are made up. Plug in your own.
| Step | Number | The math |
|---|---|---|
| SEO spend for the quarter | $18,000 | $6,000 a month × 3 (agency, writers, tools) |
| Organic demo requests | 36 | From the demo form |
| Sales-accepted | 18 | 18 ÷ 36 = 50% |
| Opportunities created | 6 | 6 ÷ 18 = 33% |
| Closed-won customers | 2 | At a $24,000 annual contract |
| Sourced pipeline | $144,000 | 6 × $24,000 |
| New ARR | $48,000 | 2 × $24,000 |
| Organic CAC | $9,000 | $18,000 ÷ 2 |
| Monthly gross profit per customer | $1,600 | $24,000 × 80% margin ÷ 12 |
| CAC payback | 5.6 months | $9,000 ÷ $1,600 |
Three limits. This CAC counts SEO cost only, so add sales cost for a fully loaded number. Two closed deals is too few to judge, so use a trailing 12 months. And if the accepted share had been 20% instead of 50%, you’d look at your keywords first, not at sales.
Which KPIs to run at your stage
| Stage | Run these | Hold off on |
|---|---|---|
| Seed, a few deals a quarter | 1, 2, 3 (by hand, in a sheet), 4 | 6 and 7. With a few deals, CAC jumps by whole customers. |
| Series A, a sales team and a CRM you trust | Add 5 and 6 | 7, until you have two quarters of closed deals |
| Series B, the board asks about efficiency | All seven. Report 7 on a trailing 12 months, with branded and non-branded split | Nothing |
Not a fit if your CRM source field is wrong or blank. Fix that first. Every revenue KPI depends on it.
Six KPIs to ignore as headline numbers
Keep collecting these. Stop reporting them as results.
| Stop leading with | Why it misleads | Lead with |
|---|---|---|
| Total organic sessions | Mixes buyers with students and job seekers | KPI 1 |
| Average position across all keywords | Thousands of long-tail terms bury the 30 that matter | KPI 2 |
| Domain Rating or Domain Authority | Third-party estimates (Domain Authority). Search Console never shows them. | KPI 2 and 6 |
| Bounce rate and time on page | Neither says whether the right person showed up. A fast visit to a pricing page can be a perfect visit (bounce rate). | KPI 4 |
| Raw impressions | AI features can add impressions without clicks | KPI 1 |
| Number of ranking keywords | Often a pile of “what is” terms nobody buys from | KPI 2 |
What “good” looks like
Published B2B SaaS conversion benchmarks disagree by a factor of 24, because they measure different things.
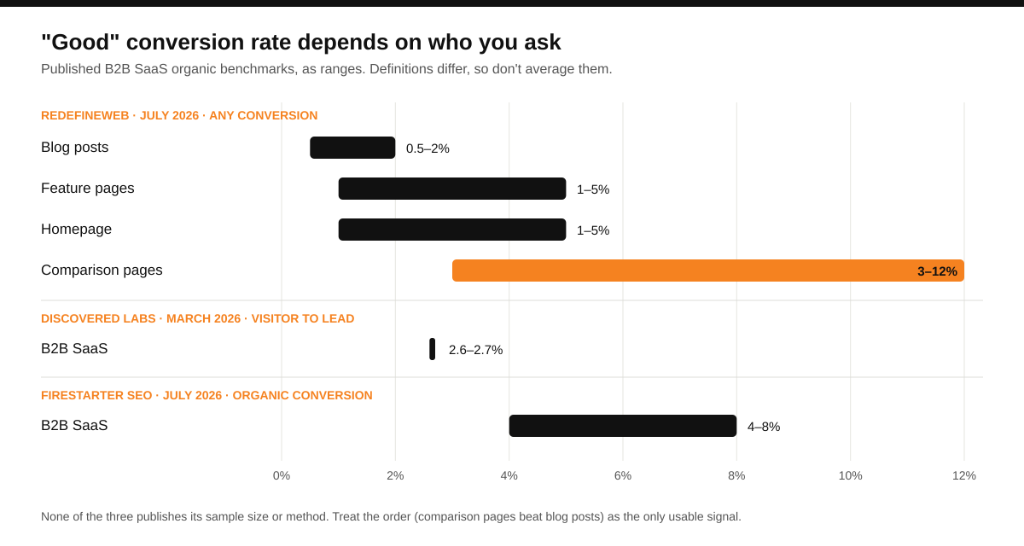
None of the three shows its sample size or method. RedefineWeb calls its ranges directional. The one pattern worth keeping is the order: comparison pages convert far better than blog posts.
Set your own baseline instead. Pull the last 90 days of KPI 4 by page type, then aim to beat that number.
Click-through rate moves too. In Seer’s data (53 brands, January 2025 to February 2026), organic CTR on queries that showed an AI Overview fell to 1.31% in December 2025. It recovered to 2.36% by February 2026. Queries without an AI Overview reached 3.82%. Seer calls its data directional and says to use your own, so set CTR targets by query type, not one number for the whole site.
How to measure these honestly
Four setup jobs. None needs a new tool.
1. Add an AI channel in GA4. GA4 has no AI channel by default, so visits from ChatGPT or Perplexity scatter across Referral, and some arrive with no source at all and land in Direct. Make a custom channel group with a source match for chatgpt, perplexity, gemini, copilot and claude.ai, and put it above Referral. Our tracking guide has the steps.
Then keep the numbers in proportion. Refine Labs gets 1 to 17 ChatGPT sessions a day on its own site, and 58% of those landed on the homepage (Refine Labs, November 2026). That’s one B2B site, so don’t treat it as a rule. But it shows the likely use: AI referral traffic is often a buyer checking you out, not a conversion-rate KPI.
At that volume, a week of data can’t tell a tracking bug from a slow week. ChatGPT links dropped their tracking tag from about October 8 to 15, 2026, and those visits landed in Direct. Annotate that week in GA4.
2. Ask the buyer. Add “How did you hear about us?” to the demo form as a required free-text box. No dropdown. Store the answer on the contact and copy it to the deal. Refine Labs ran this for 12 months on 620 conversions. HubSpot credited 78% to web search (direct and organic). Buyers named web search 12% of the time (Refine Labs).
That’s one demand-gen company with a big podcast and LinkedIn presence, so don’t expect your split to match. The size of the gap is the point. It may make SEO look smaller. You’d still rather know. Tag the answers monthly: Google, ChatGPT or other AI, LinkedIn, referral, podcast, other.
3. Know what Search Console can’t tell you. Google counts AI Overview and AI Mode traffic inside the normal Web search totals (Google). Since June 2026 there is also a Generative AI report, now open to all sites, showing impressions by page, country, device and date. It reports impressions, not clicks (Search Engine Journal). You can see which pages appear in AI answers, not what they sent.
Google says clicks from AI Overviews tend to be higher quality, meaning people spend more time on the site. Check that in your own GA4.
4. Report AI mention rate with its range. State how many answers sit behind the number. With 100 answers, a 30% mention rate could really be anywhere from about 21% to 39%. That’s ordinary sampling error, and it’s why a move of a few points means nothing.
Frequently asked questions
How long before B2B SaaS SEO KPIs show results?
In order: visibility, then conversion, then revenue. Pages have to be indexed and ranked before anyone clicks, and pipeline and CAC then lag by your sales cycle. In a first 90-day plan, judge KPIs 1 to 3 and treat 4 to 7 as baselines.
Do rankings still matter if buyers ask AI assistants?
Yes. Google says AI Overviews and AI Mode have no extra requirements: a page must be indexed and eligible to show with a snippet (Google). For other assistants the picture is less clear, which is why KPI 3 exists.
Should I report branded search?
As its own line, never inside KPI 1. Branded clicks mostly come from people who already know you, whether from a podcast, LinkedIn or an AI answer. Rising branded impressions next to a rising AI mention rate is worth noting. It isn’t proof.
What if we don’t have a CRM or enough deals?
Run KPIs 1, 2 and 4 now. Log the source and the “how did you hear” answer for every demo in a sheet. Add pipeline once you have a few quarters of deals. Fix source tracking before anything else.
Your next step
This week, write down your 30 money keywords, add the free-text field to your demo form, and set up the GA4 AI channel. That’s about an afternoon. Then pull your last 90 days of demo requests by page type. That’s your baseline.
If you’d like a second pair of eyes on it, our strategy call is 45 minutes with Sitab, followed by a custom 90-day plan. Book a strategy call.